Earthquake
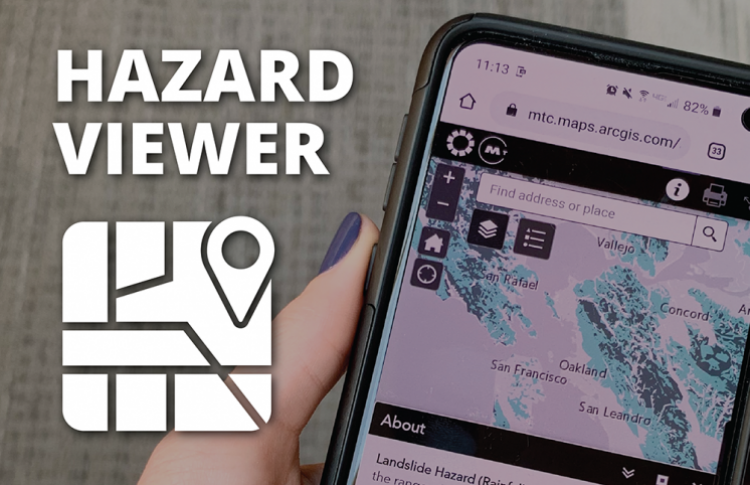
In the Bay Area, the high probability of earthquakes makes planning and mitigation essential for homeowners, cities and counties. The following collection of mapping resources brings together the most comprehensive, up-to-date data sets available from multiple agencies to visualize and understand earthquake risk at the household-, neighborhood-, jurisdiction- and county-level.
Earthquake: Risks & Resources
Earthquakes are an unavoidable feature of the Bay Area’s risk landscape. In the past 150 years, the region has experienced 22 earthquakes of a magnitude six or greater, forces which can cause damage to built structures. Currently, there is a 72% chance over the next 30 years of a magnitude 6.7 or greater earthquake in our region.
Earthquakes bring with them attendant hazards, including liquefaction and landslide. Use the maps below to understand the earthquake-related risks in this region. Homeowners can find information about residential seismic risk and hazard mitigation at the Home Quake Quiz.
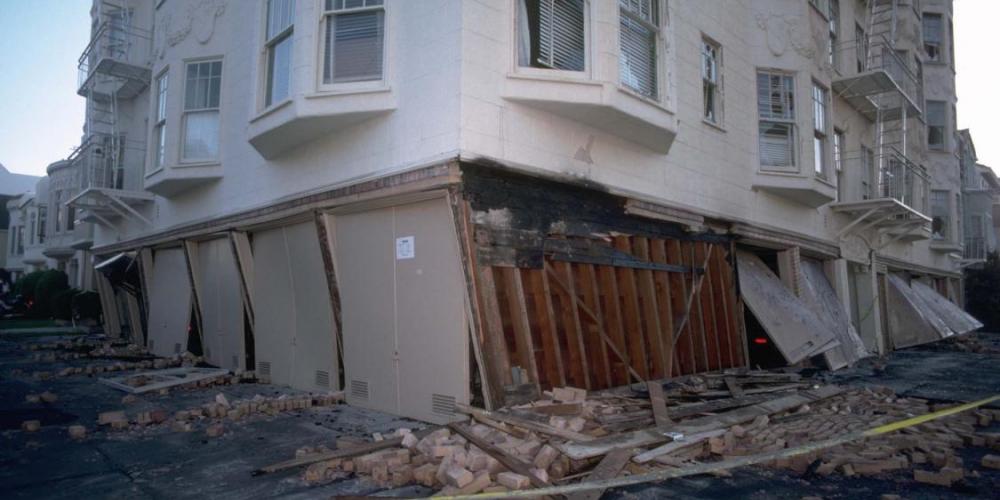
Shaking
The most familiar result of earthquakes, shaking is a force that damages buildings and infrastructure.
Modified Mercalli Intensity (MMI) Scale
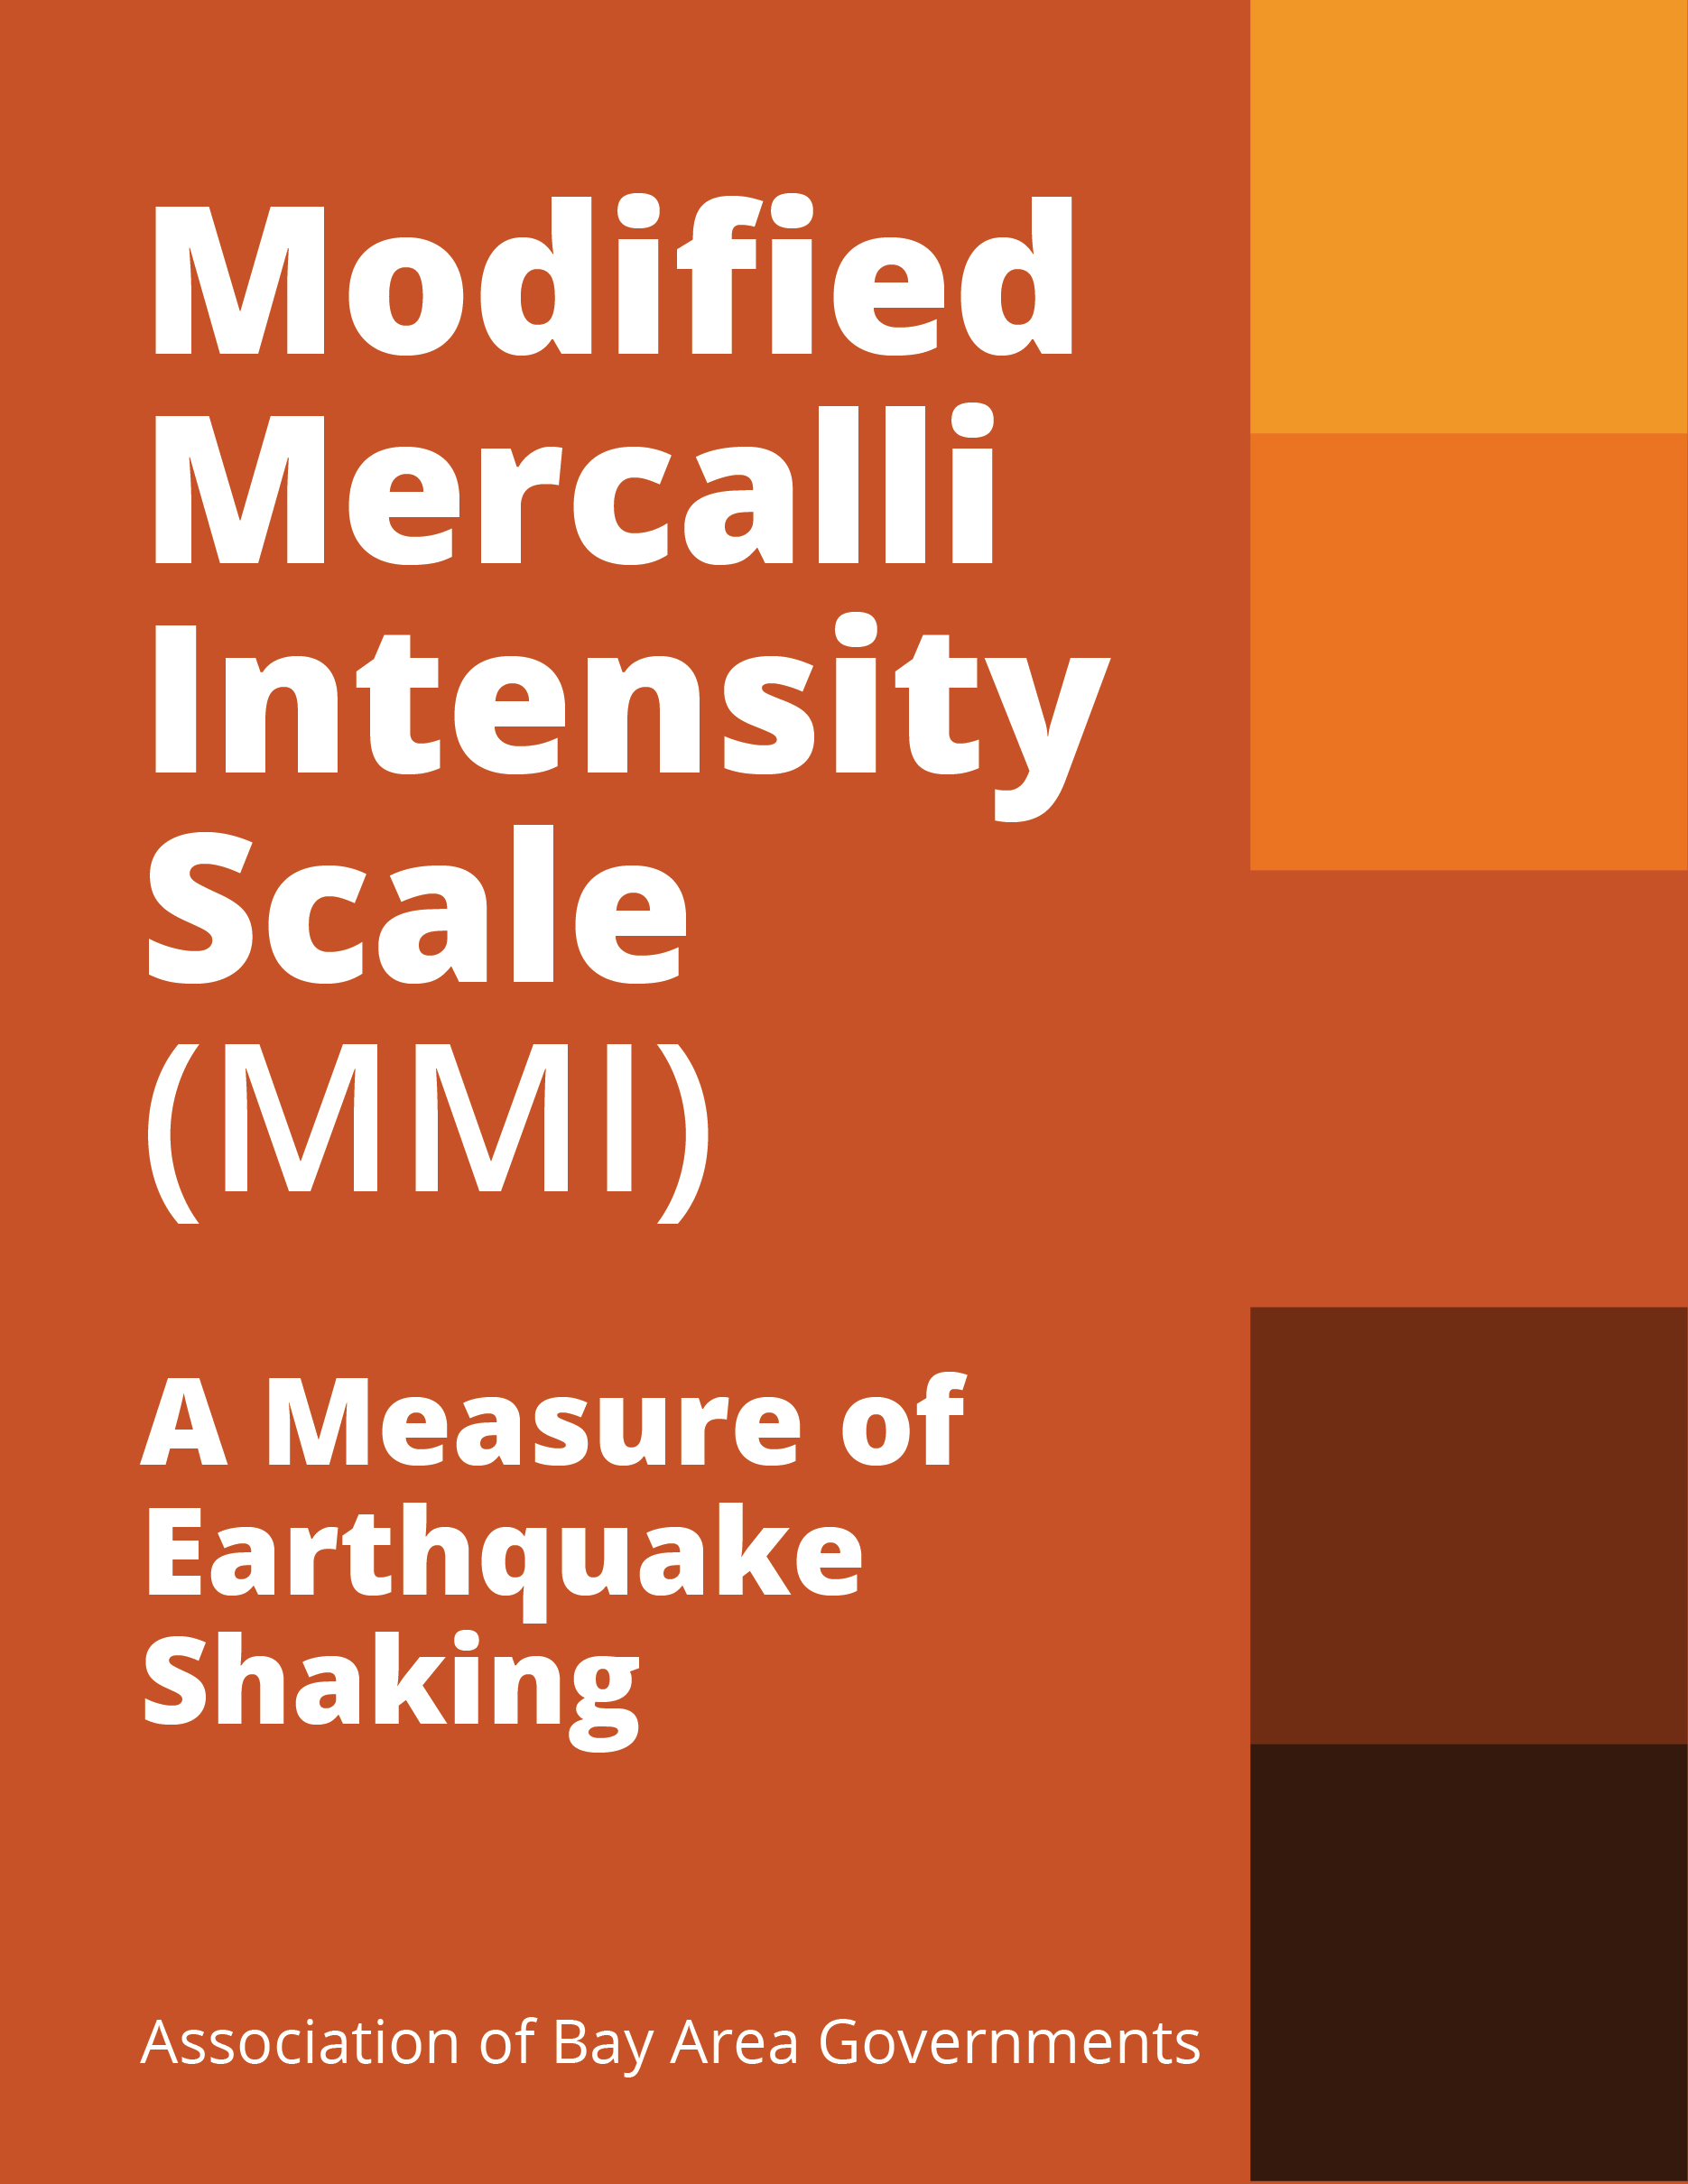
Earthquake shaking is measured using the Modified Mercalli Intensity (MMI) Scale. Whereas the magnitude of an earthquake describes how much energy is released by an earthquake, calculated according to the length of a fault rupture and how far it slipped, the MMI scale describes the intensity of earthquake shaking at a specific location by considering its effects on people, objects and buildings. At MMI>6, some buildings begin to sustain damage.
Probabilistic Earthquake Shaking Hazard
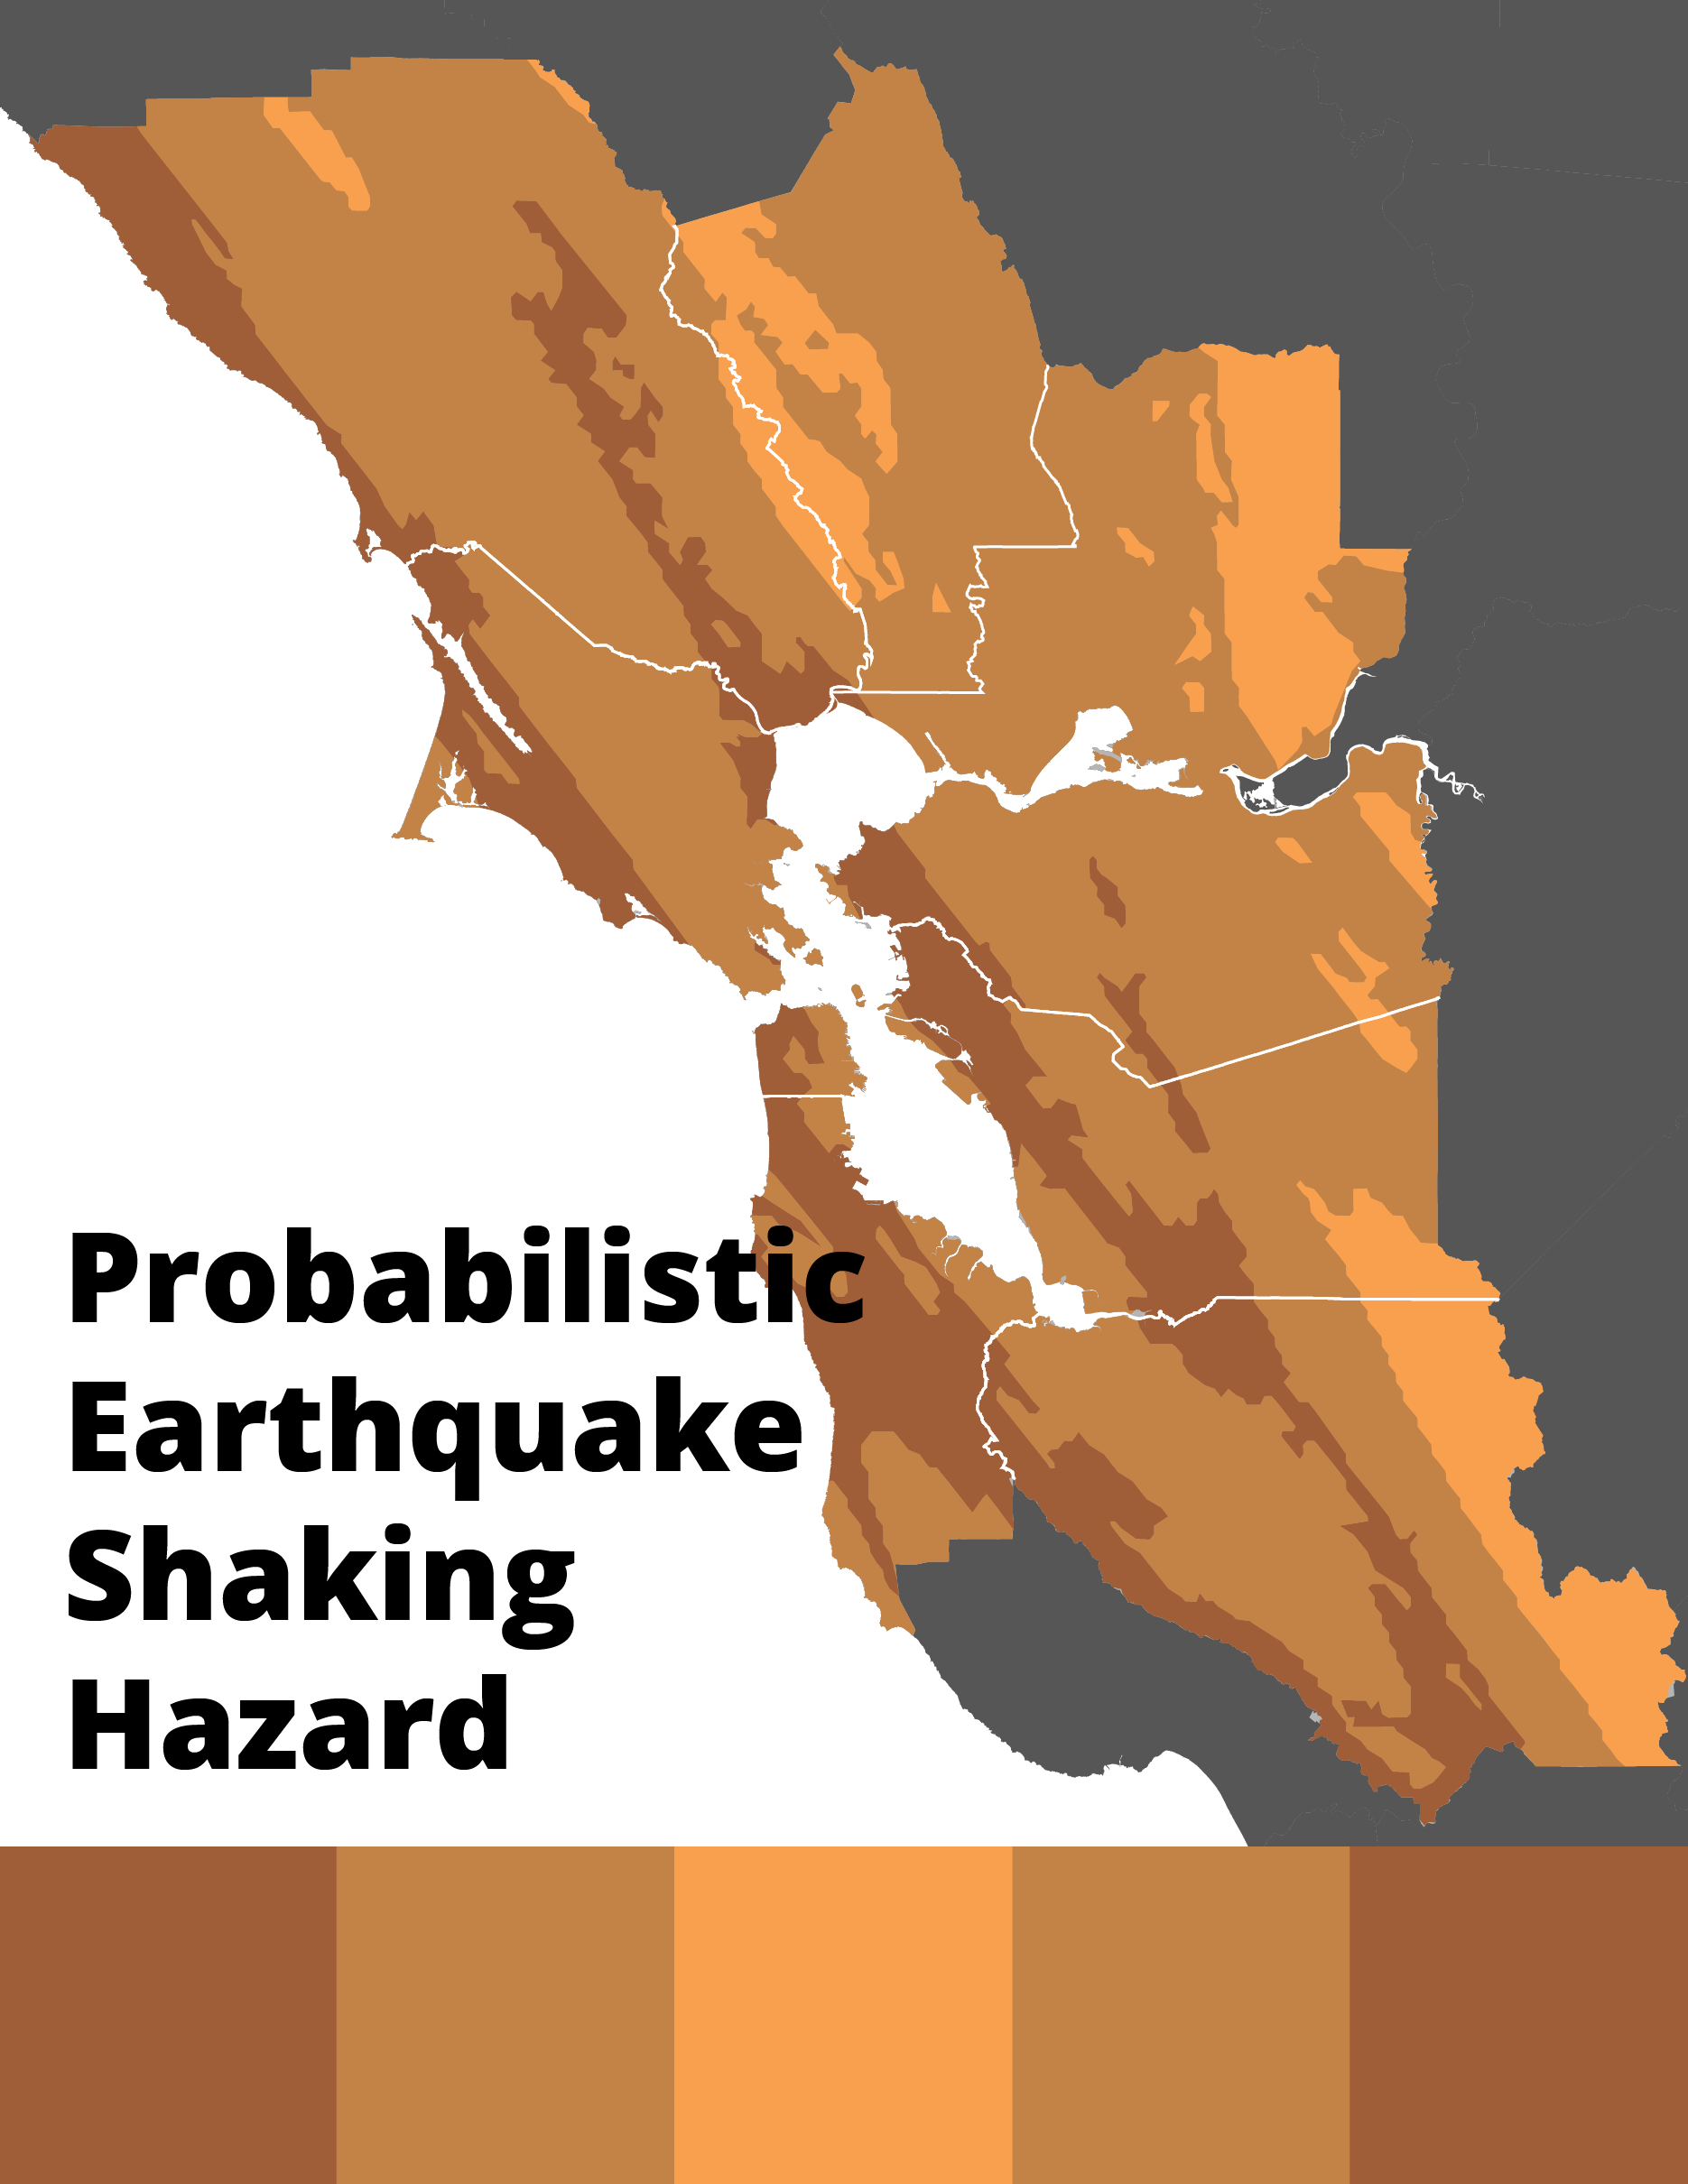
This Probabilistic Earthquake Shaking Hazard Assessment is a composite shaking map. It combines all possible earthquake scenarios, using the Modified Intensity (MMI) scale to illustrate the aggregate shaking hazard for every location in the Bay Area. For specific earthquake scenarios, consult the Future Earthquake Shaking Scenarios (below) to understand how an individual earthquake results in a location’s shaking hazard.
Earthquake Shaking Scenarios
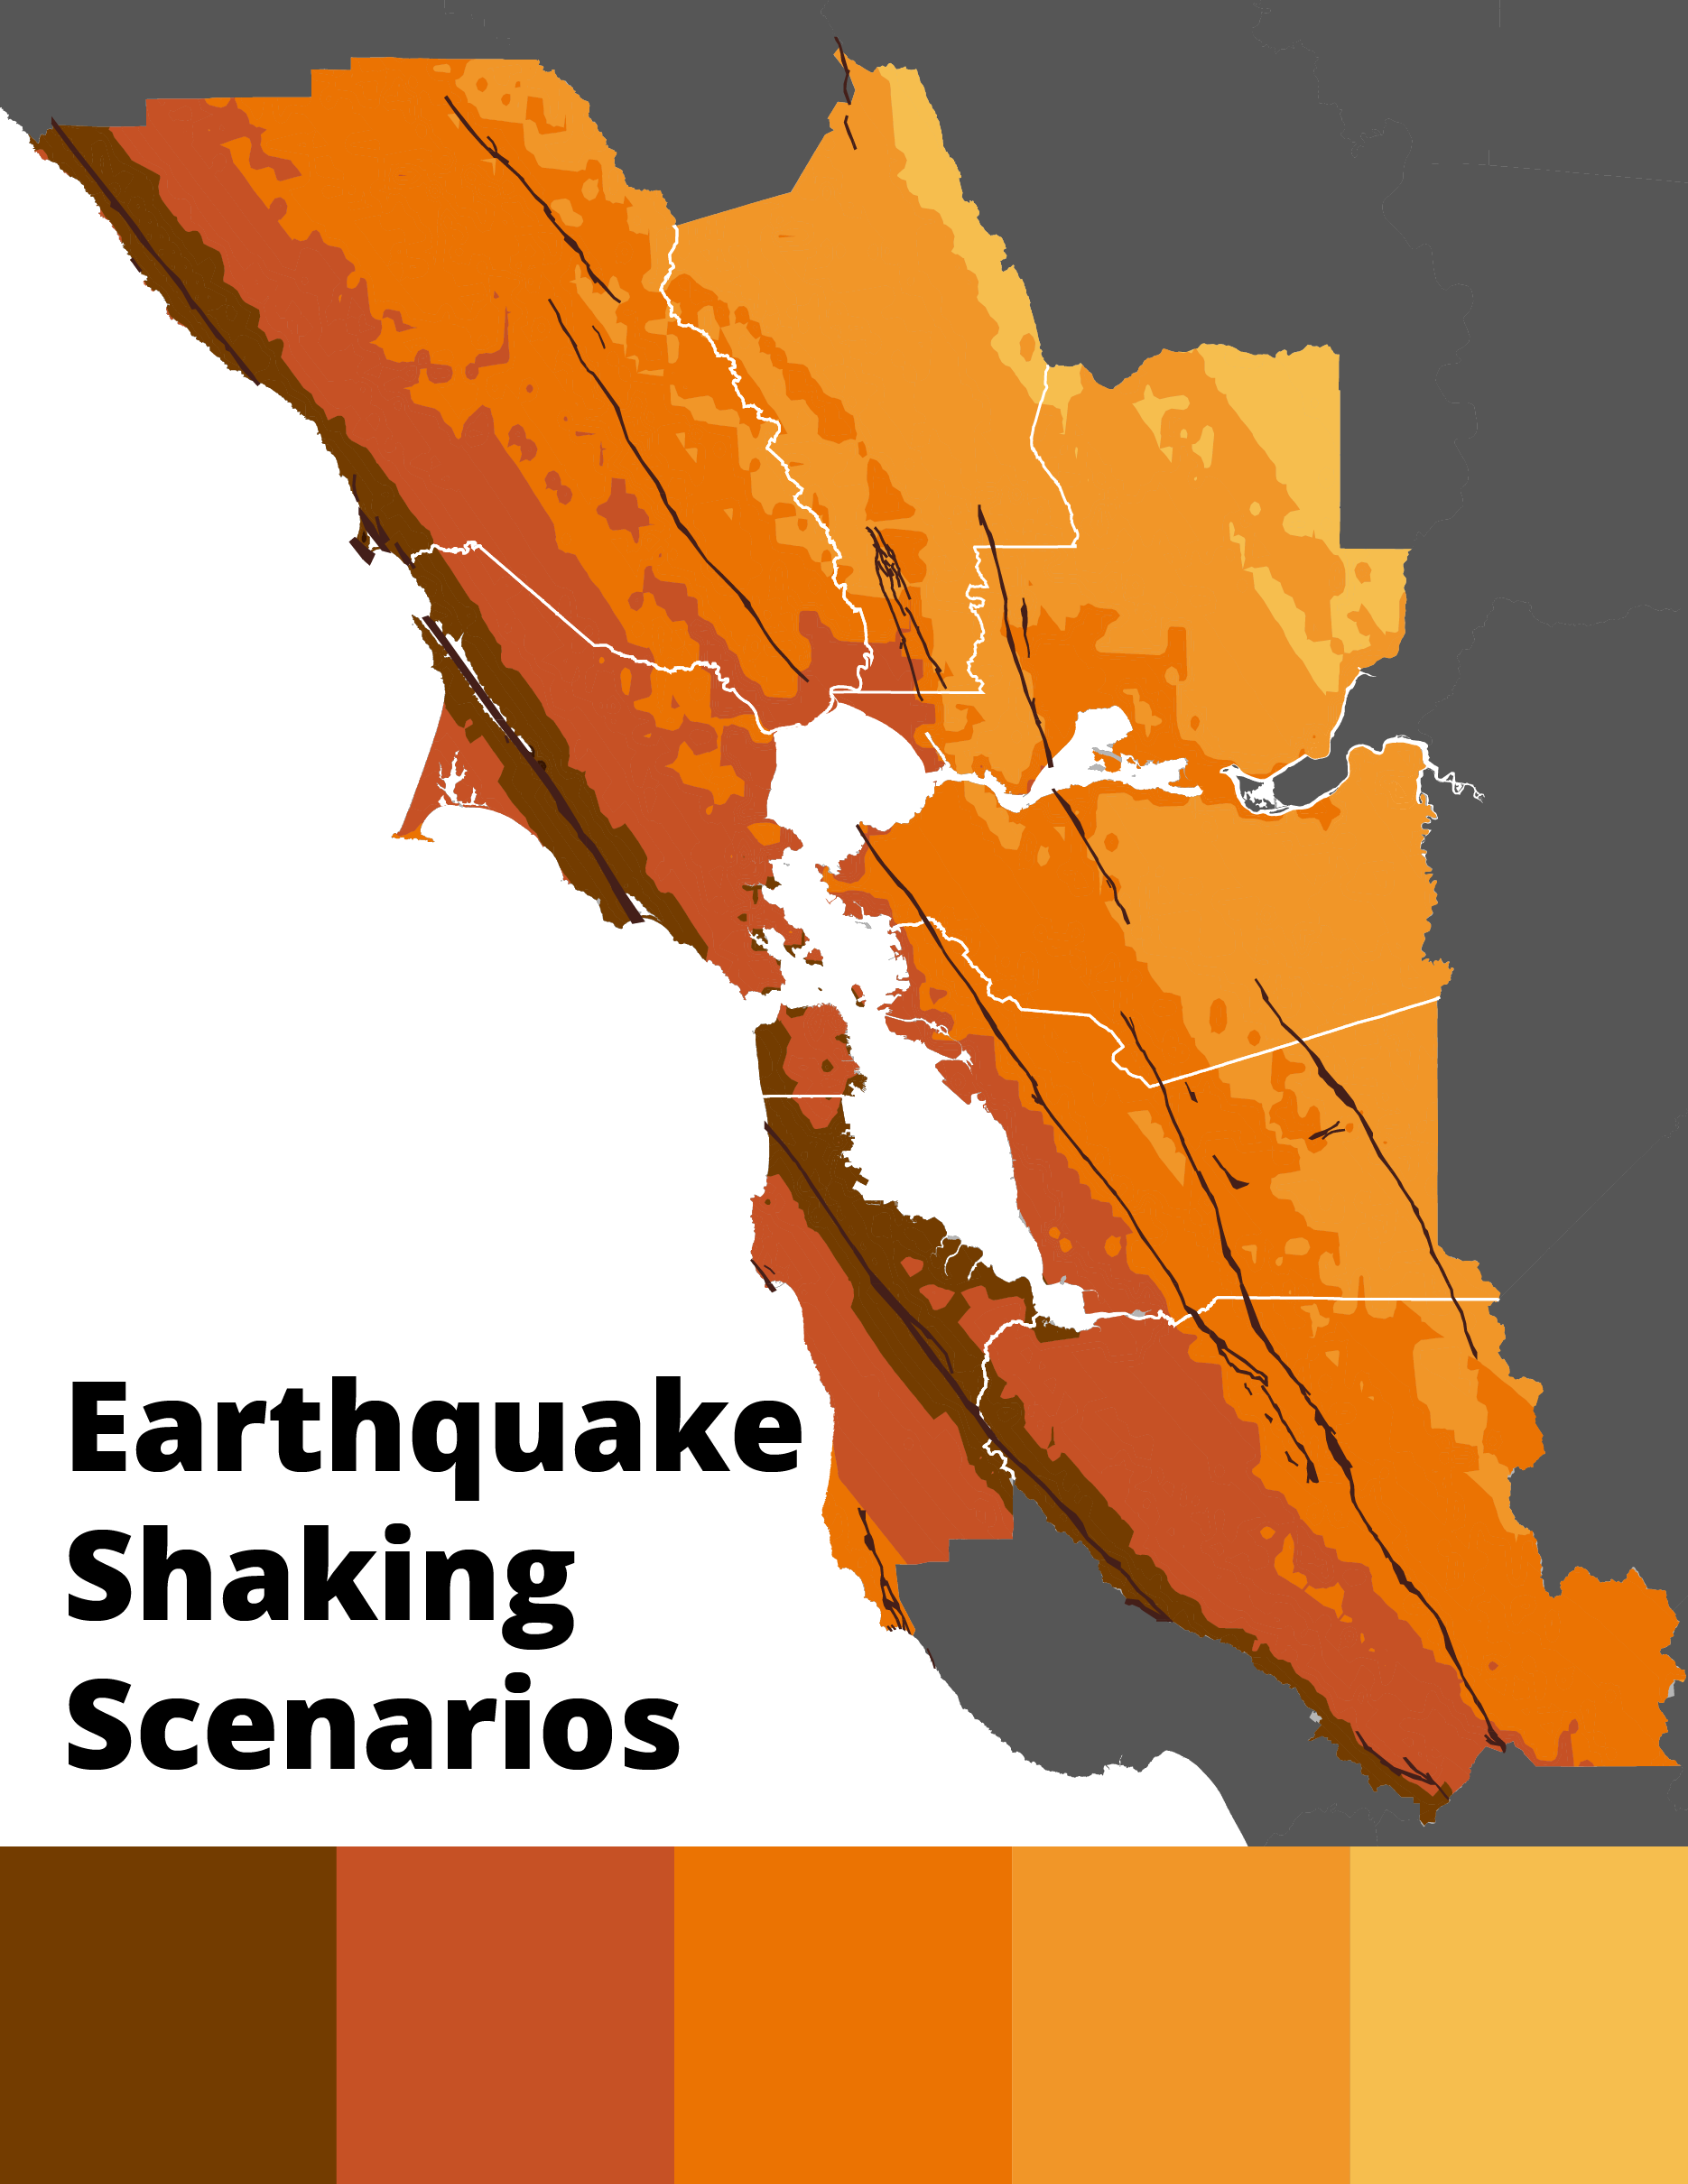
A number of different earthquakes are possible in the Bay Area. The Hazard Viewer offers 16 unique shaking scenarios to help visualize how individual shaking scenarios might impact your area. To identify the earthquake fault segments that contribute most to each area’s shaking hazard earthquake risk, use the “Earthquake Deaggregation” map. Then select the fault that most strongly affects your area to see localized shaking risk.
Fault Rupture
Weaknesses in the earth’s crust where tectonic plates slip past each other, Bay Area faults power the region’s earthquakes. Earthquakes most typically result in shaking-related damage, but faults can also rupture the surface.
Earthquake Fault Zones
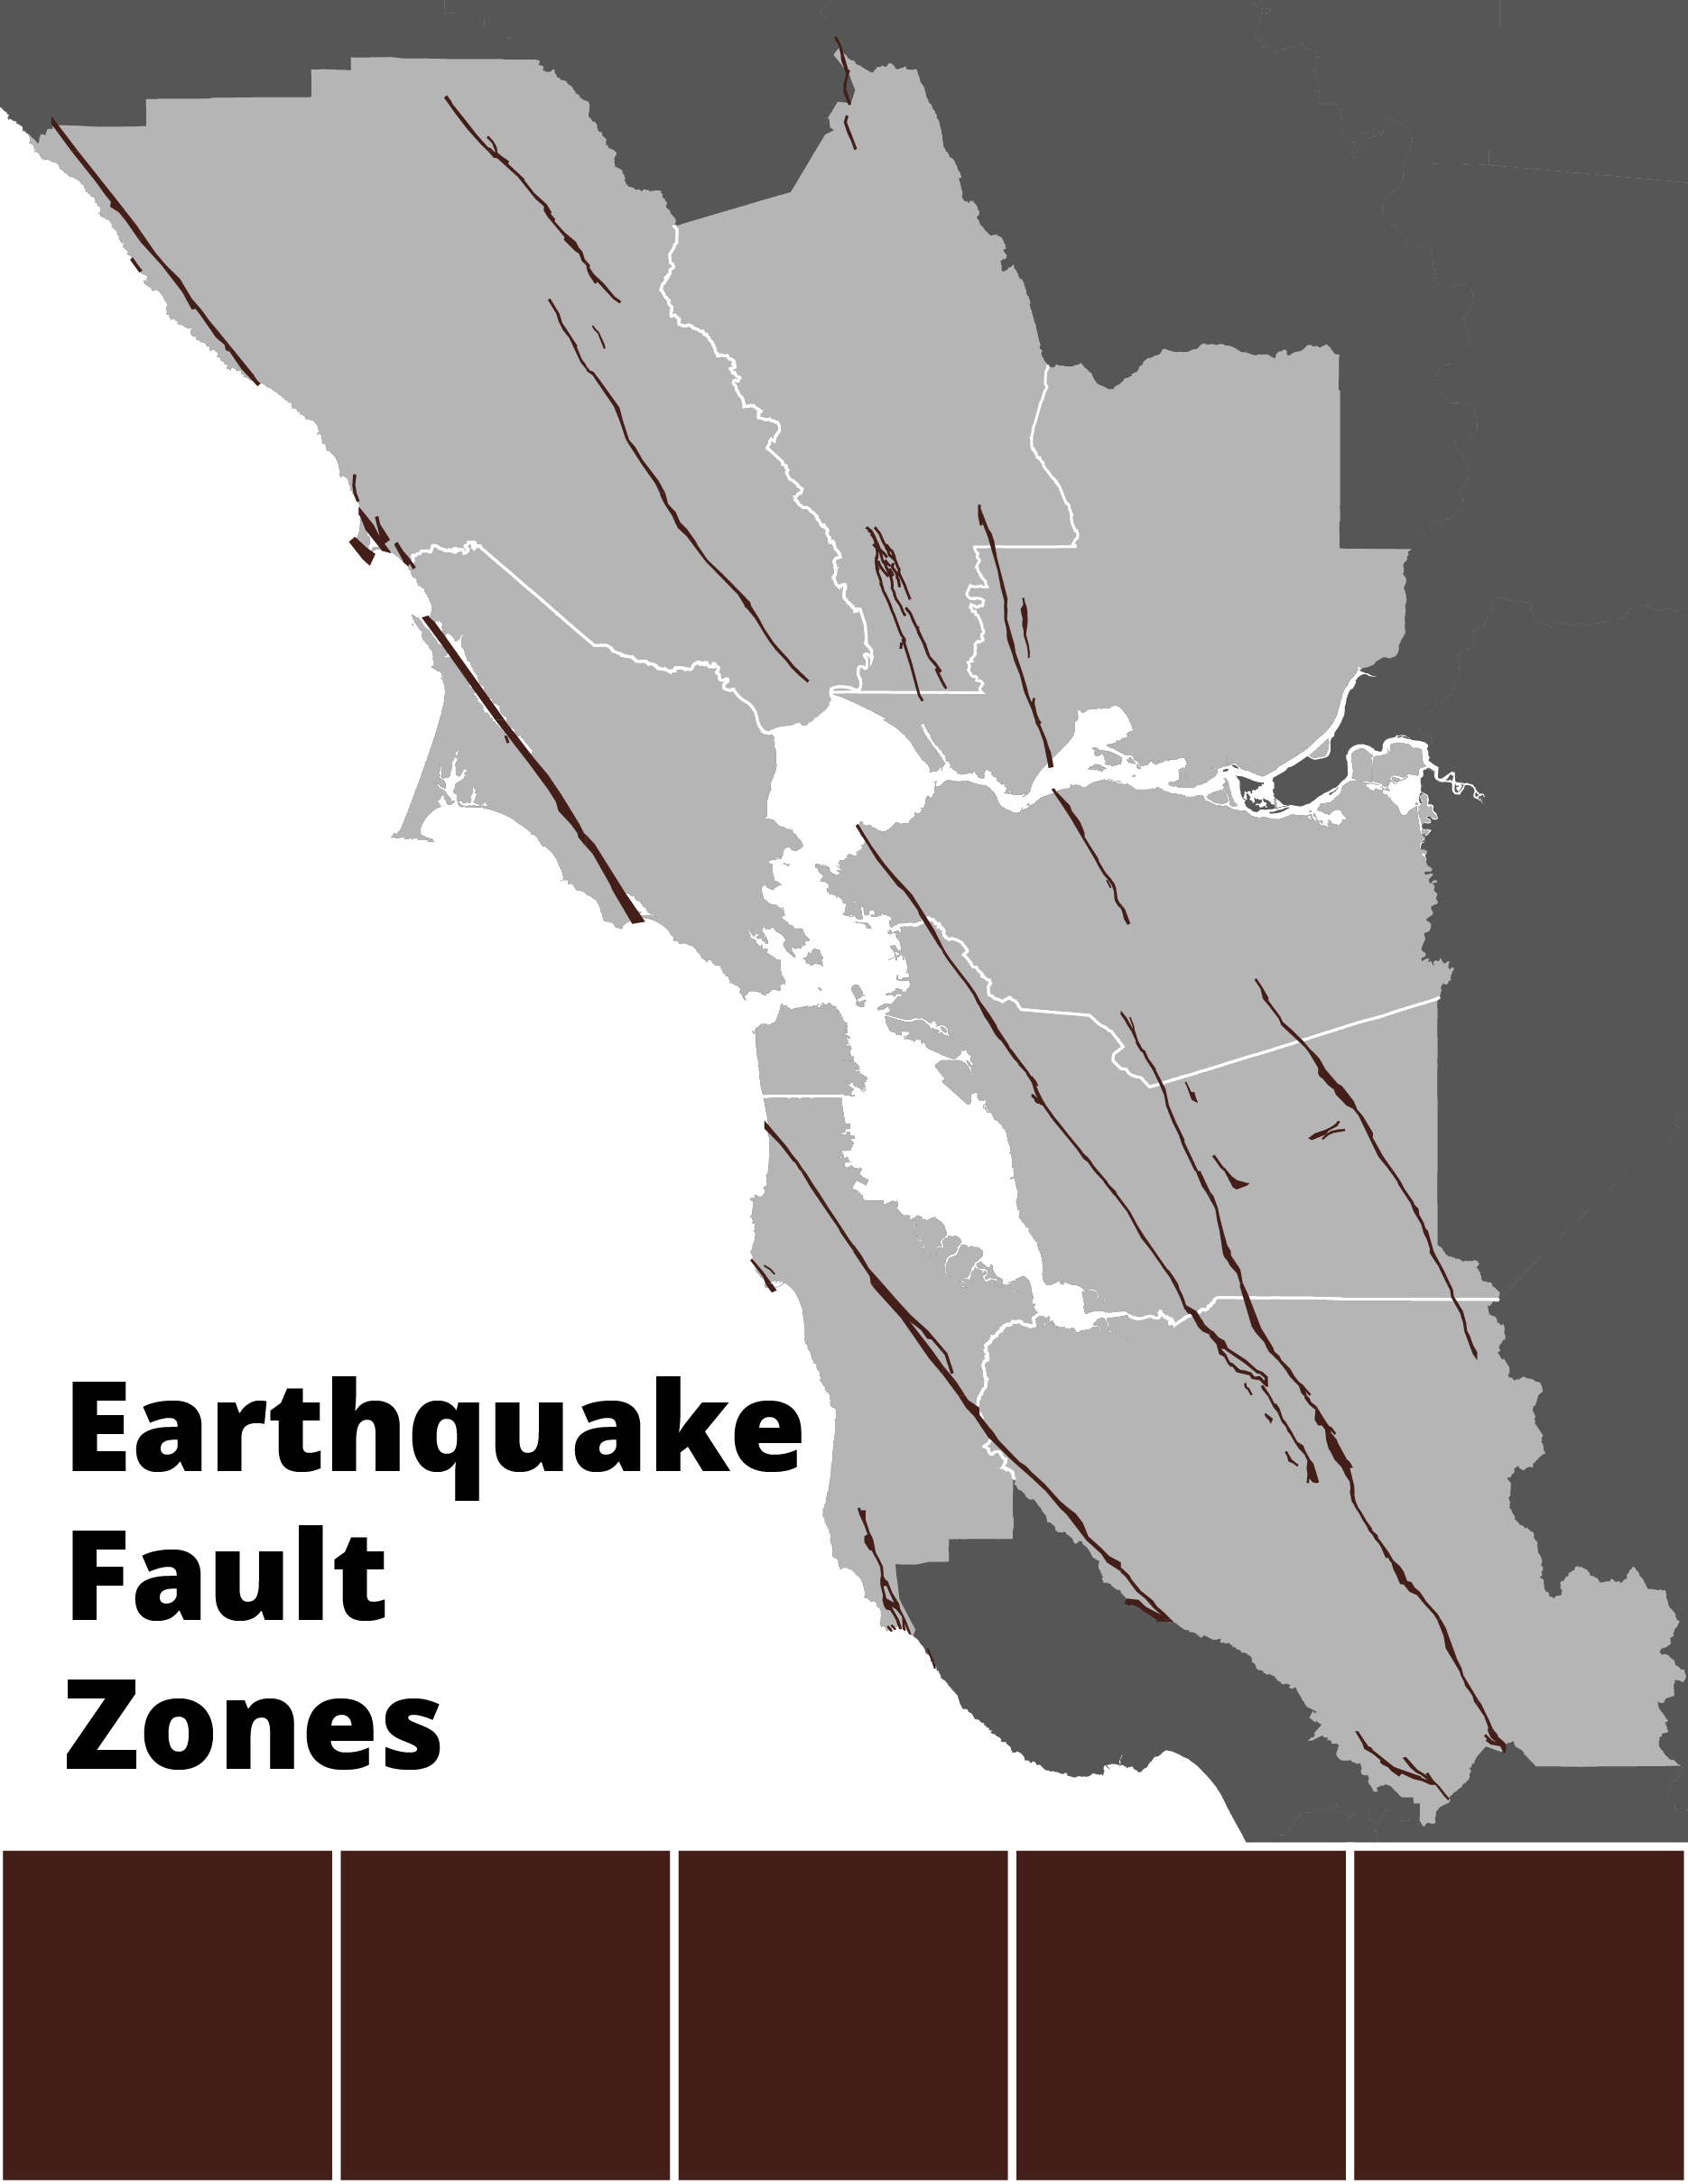
Alquist-Priolo Earthquake Fault Zones are regulatory zones at the site of trace surface ruptures, viewable in the Hazard Viewer. The California Geological Survey publishes the most comprehensive depiction of fault traces that can rupture the surface. For more information about the zones in which cities and counties must require special geologic studies to prevent the building of structures intended for human occupancy and in which the surface rupture hazard must be disclosed in real estate transactions, visit the California Department of Conservation's Alquist-Priolo Fault Zones page.
Liquefaction
During intense shaking, loose, sandy, silty and saturated soils act like liquid, causing significant damage to airport runways, roads, pipes and building foundations. Liquefaction susceptibility maps indicate areas in which soil types have the potential to liquefy during intense shaking. The Real Dirt on Liquefaction provides helpful background on liquefaction hazards and possible impacts and solutions for the Bay Area.
Liquefaction Susceptibility Map
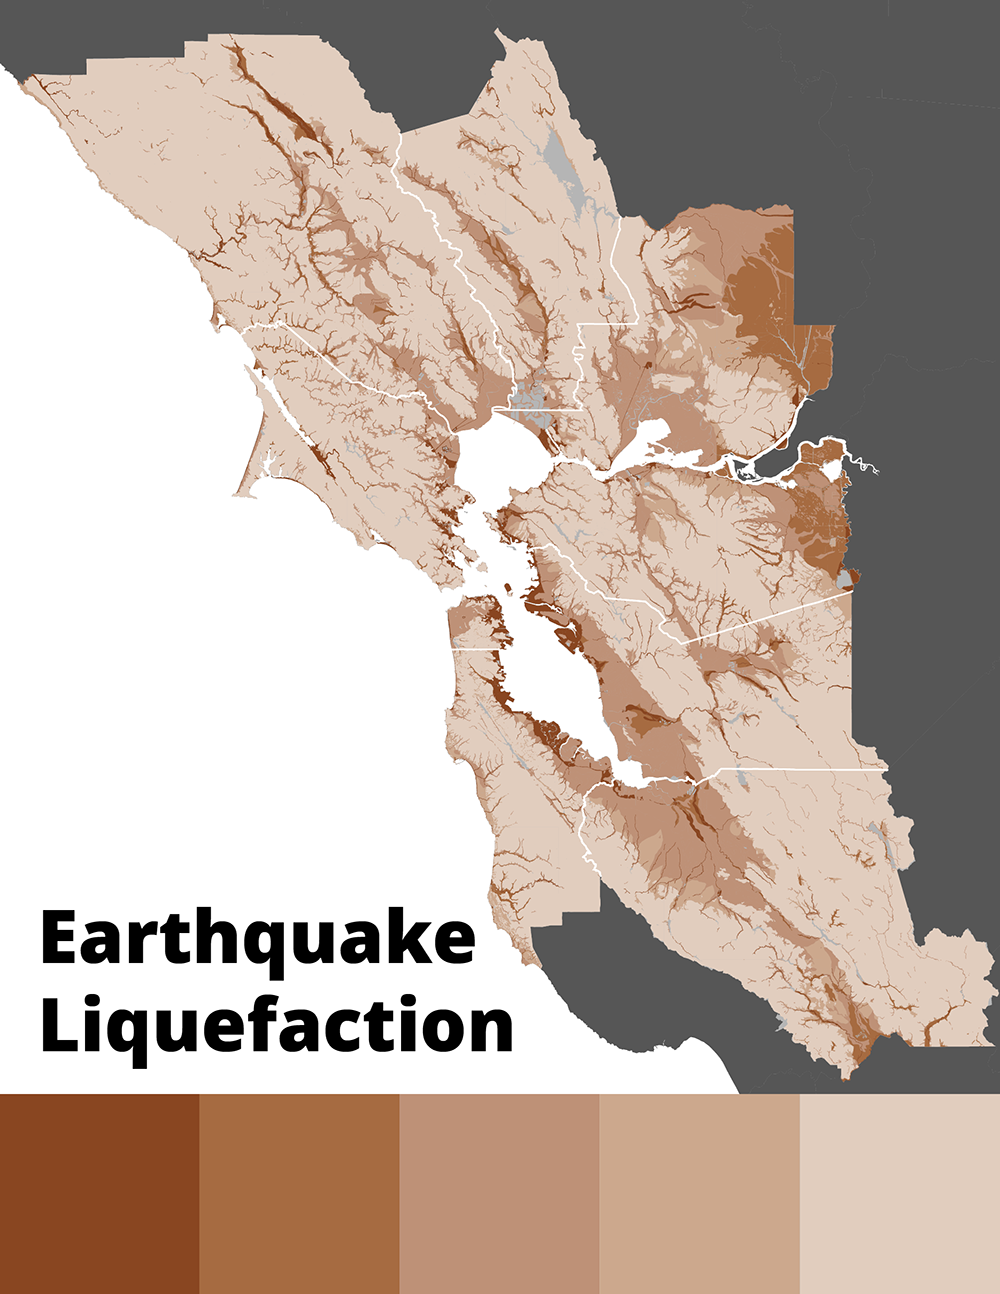
This regionally complete map indicates the graded level of liquefaction risk for each area, from very high risk to very low risk.
This map is not a substitute for a site-specific investigation by a licensed geologist or geotechnical engineer.
Official California Seismic Hazards Zone Map
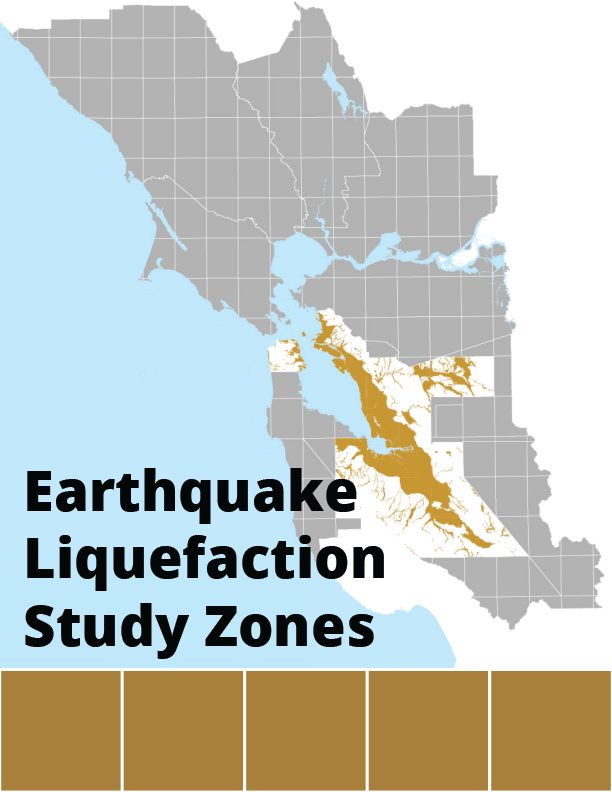
California Geological Survey (CGS) Seismic Hazards Zonation Program
This state regulatory map shows “Zones of Required Investigation” for liquefaction (and landslide) hazard. It does not depict different degrees of hazard. Instead it identifies zones within which site-specific studies will be required for new construction. Sellers of properties within a “Zone of Required Investigation” must disclose that fact to prospective buyers. Government plans are required to include information about hazards reflected in this map, if available. This information is not viewable on the Hazard Viewer, but the data is downloadable from the Open Data Catalog. This data set is not regionally complete. Some areas of the region remain unmapped.
Landslide
Earthquakes can trigger landslides, typically in weak soil and rock on sloping terrain. In the Loma Prieta earthquake, earthquake-induced landslides disrupted traffic for a month along Highway 17 in the Santa Cruz Mountains. In the Bay Area, the CGS has mapped areas of earthquake-induced landslide hazard as part of its Seismic Hazards Zonation Program.
Earthquake-induced Landslides
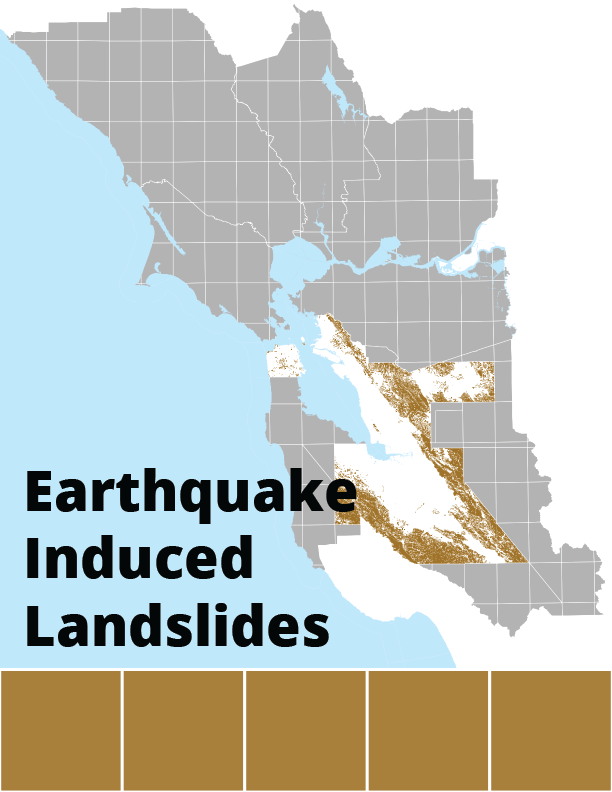
California Geologic Survey (CGS) Seismic Hazards Zonation Program
This map identifies the possibility of an earthquake-induced landslide occurring in a future earthquake. It is derived from State-mandated regulatory maps that show “Zones of Required Investigation” for landslide (and liquefaction) hazard. They do not depict different degrees of hazard. Rather, they identify zones within which site-specific studies will be required for new construction. These zone maps also are used in real estate transactions; sellers of properties within a “Zone of Required Investigation” must disclose that fact to prospective buyers. This data set is not regionally complete. Some areas of the region remain unmapped.
Implementation
Assess your risk with the Home Quake Quiz and use these tips to boost your personal preparedness for Bay Area earthquakes.
Policy
Bay Area governments can help their jurisdictions mitigate earthquake hazards by developing Housing and Infrastructure Policies, using the resources and tools the Resilience Program has curated.